Creating random values in a normal distribution in BigQuery
- timandrews1
- Jul 12, 2022
- 2 min read
Some languages, such as R, have built in functionality to pull random numbers from a normal distribution. Other languages and development environments, such as BigQuery, are able to pull random numbers from an even distribution, but lack built-in functionality for random numbers within a normal distribution.
Why create a normal distribution?
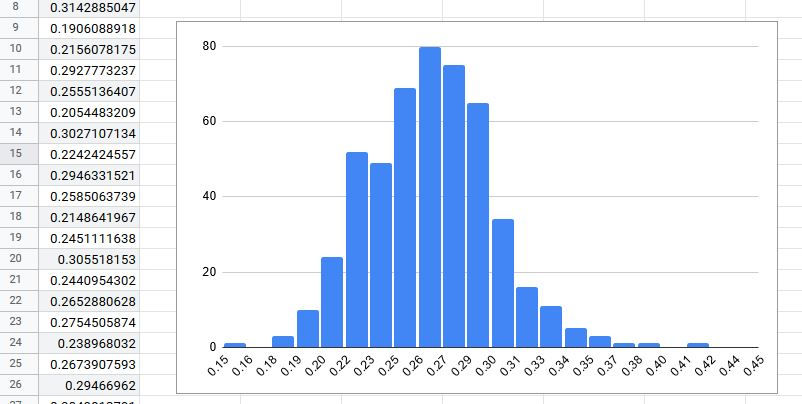
Imagine a use-case in which we need to generate a set of random batting averages for baseball players, as sample data. If we observe that typical batters have between a .190 and .370 batting average, we wouldn't want to generate just a many players at or above .350 as we would players between .260 and .280. Players who hit .350 and higher are exceptional hitters - we only want a small portion of those really high batting averages to be generated.
Instead, it would be nice if we could generate values where typical players bat .265 and one standard deviation falls, for example, between .230 and .300.
Creating our own function
It's easy enough to create our own table-valued function in BigQuery, based off the Box-Muller Transform. The goal of our function will be as follows:
Accept an input for the mean of our distribution
Accept an input for the sigma of our distribution
Accept the number of rows to generate (each row will yield two random values in the Box-Muller transform)
Our function is defined as follows:
CREATE OR REPLACE TABLE FUNCTION misc.box_muller(mu FLOAT64, sigma FLOAT64, number_of_rows INT64) AS /* Accepts mu, sigma and number of rows to generate, running the box-muller transform to output random, normal values: https://en.wikipedia.org/wiki/Box%E2%80%93Muller_transform */ WITH initial_rands AS ( SELECT RAND() AS u1, RAND() AS u2 FROM ( SELECT * FROM UNNEST(GENERATE_ARRAY(1, number_of_rows)) AS RowNum ) ), added_mag AS ( SELECT *, sigma * sqrt(-2.0 * log(u1)) AS mag FROM initial_rands ), /* Since this is a table-valued function, we cannot declare variables ,otherwise, we would have made a constant for pi */ final_numbers AS ( SELECT *, mag * cos(((ACOS(-1))*2) * u2) + mu AS z1, mag * sin(((ACOS(-1))*2) * u2) + mu AS z2 FROM added_mag ) SELECT z1, z2 FROM final_numbers;
Our function is simple and straightforward. Although BigQuery lacks the ability to perform DDL and DML operations within table-valued functions, BigQuery still allows us to build something concise and intuitive by nesting CTEs to generate the variables needed for the algorithm.
Calling our function, and visualizing the results
We can generate 500 sample rows by calling our function as follows:
SELECT * FROM misc.box_muller(.265, .035, 500);
By far, the most efficient way to determine if a distribution is normal is to visualize it, especially if there are more rows than can fit on a single page.
One aspect about the BigQuery cloud UI that I love is the integrated functionality to visualize query results in Google Sheets. After pressing that button and just a little bit of prep work, we are able to quickly verify that our sample set is a normal distribution:
Comments